Geospatial intelligence for asset decisions — Property Intelligence

Spatialzr LISA combines geographic analysis, structured public data and multi-variable AHP models to guide investment, arbitrage and expansion decisions toward the right locations — faster, with greater confidence.

2404_map_3.png

Results delivered in operational form

4 formats

Interactive maps and dashboards

H3 cell-by-cell visualisation. Use-specific heatmaps (Retail, Office, Residential, Industrial). Top tier identified by Jenks method + transport filter.

Ranked location shortlists

Ranking of the N best cells for a given use on a given territory. Comparable across geographies. Ready for investment committee.

Exportable scores — structured data

Spatialzr LISA dataset delivered as CSV/XLSX. 300+ raw variables, intermediate levels, aggregated scores by use. Compatible with Excel, AVMs, internal models.

Executive-ready reports

1-page executive summary · Thematic breakdown · Relative positioning (percentiles) · Forward-looking read. Defensible format for investment committees.

300+ variables · 6 dimensions · 4 asset types

6 dimensions:

M — Metropolis :

size, urban position (Core/Hinterland/Outerland), GDP, demographics

T — Transport :

public transport, intercity (TGV/airport), road network, multimodality

R — Retail :

merchandising mix, retail density, typologies, commercial surface

B — Business :

land use, activity zones, office/industry ratio, connectivity

C — City Life :

education, soft mobility, green spaces, urban amenities

E — Environment :

noise, flood risk, air quality, light pollution

4 models by use :
RETAIL · OFFICE · RESIDENTIAL · INDUSTRIAL — AHP weights optimised by typology. Absolute score 0–10 + relative positioning by percentile on territory.

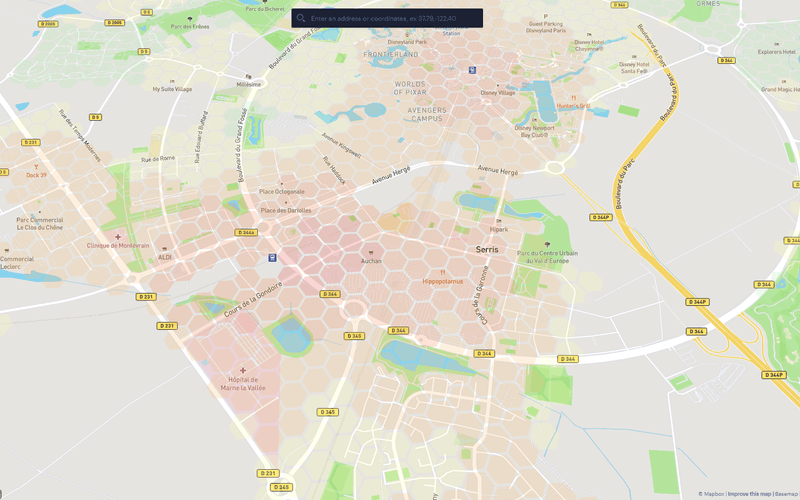
Unit of analysis : the H3 cell
Hexagonal geospatial (~50m diameter). Each cell is independent, scored, comparable. Not a zone, not a district: the exact cell.

What LISA does that no one else does

What others provide What LISA delivers
Broker market note: aggregated snapshot, 6–12 month lag Forward-looking score of the exact cell, before the decision
Comparison only possible within the same market Like-for-like comparable across all geographies I
Non-audited expert opinion Structured methodology, 300+ variables, auditable
Past transaction data (MSCI, CBRE Research) Attractiveness trajectory — not what happened

Request an analysis of your asset or portfolio

Delivered within 48h. France and UK. Dataset + interactive map + AI script.

Made with
By using this website you agree to our Cookie Policy.

Cookie Settings

We use cookies to improve user experience. Choose what cookie categories you allow us to use. You can read more about our Cookie Policy by clicking on Cookie Policy below.

These cookies enable strictly necessary cookies for security, language support and verification of identity. These cookies can’t be disabled.

These cookies collect data to remember choices users make to improve and give a better user experience. Disabling can cause some parts of the site to not work properly.

These cookies help us to understand how visitors interact with our website, help us measure and analyze traffic to improve our service.

These cookies help us to better deliver marketing content and customized ads.